



Chapter – 1. Theory of Consumer Behaviour
1.1 Preliminary Notations & Basics of Utility
1) Who is Consumer and what is consumer behaviour?
Consumer is an economic agent who consumes final goods and services to satisfy wants. A consumer is one who buys goods and services with a view to satisfying his wants. Since resources are scarce so consumer must follow law and principles for maximum satisfaction
2) What is the core objective of a rational consumer in economic theory, and what are the two main constraints that restrict their choice? (NCERT)
Ans: The core objective of a rational consumer is to maximize their total satisfaction (utility) from consuming various goods and services. The two main constraints that restrict their choice are:
- Income Constraint: The limited amount of money income available to spend.
- Price Constraint: The prevailing market prices of the goods and services.
3) Define a “consumption bundle”. If a consumer chooses quantities and of two goods with unit prices and , write the mathematical expression representing the total cost and formal representation of the bundle. (NCERT / MP 2020)
Ans: .
4) Define “utility” in economics. Explain why utility is considered a subjective concept with a brief example. (NCERT / MP 2019)
Ans: Utility is the want-satisfying power of a commodity. It measures the level of satisfaction or pleasure a consumer derives from consuming a good or service.
1. Subjective – Varies from person to person.
2. Relative – Depends on time, place, and situation.
3. Measurable – Can be measured in utils (cardinal) or ranked (ordinal).
4. Not always useful – Even harmful goods (like cigarettes) may give utility.
5. Declines with use – More consumption usually gives less added satisfaction (diminishing marginal utility)
6. Psychological phenomenon: It cannot see or touch only be imagined
7. No intrinsic value: different person may like to have the same thing for example business person purchase cigarette for sale
5) Does a commodity that yields utility to a consumer necessarily possess moral or physical usefulness? Justify your answer with a standard economic example. (NCERT / MP 2023)
Ans: No. In economics, utility is completely neutral regarding morality, health, or social ethics. A commodity possesses utility as long as a consumer desires it, regardless of whether it is useful or harmful.
Example: Alcohol or cigarettes yield utility to an addict because they satisfy a craving, even though they are harmful to health and lack physical usefulness.
6) Differentiate briefly between the Cardinal Utility approach and the Ordinal Utility approach in consumer behaviour theory. Or
Define Cardinal Utility Analysis. Mention the name of the prominent economist who advocated this approach. (NCERT / MP 2022)
Basis | Cardinal Utility Approach | Ordinal Utility Approach |
Measurement | Assumes utility can be measured numerically in quantitative units called utils (e.g., 10 utils, 20 utils). | Assumes utility cannot be measured numerically, but choices can be ranked in order of preference (1st, 2nd, 3rd). |
Main Economists | Alfred Marshall. | J.R. Hicks and R.G.D. Allen. |
Key Analysis Tool | Law of Diminishing Marginal Utility (LDMU). | Indifference Curve (IC) Analysis. |
1.2 Cardinal Utility Analysis
7) Define Total Utility (TU) and Marginal Utility (MU). Write their mathematical relationship/formulas. (NCERT / MP 2020)
1. Total Utility (TU): The total psychological satisfaction derived by a consumer from consuming a specific total quantity of a commodity.
2. Marginal Utility (MU): The additional utility derived from the consumption of one additional unit of a commodity.
8) State and explain the relationship between Total Utility (TU) and Marginal Utility (MU) with the help of a schedule and diagram. (NCERT / MP 2018, 2023)
Units Consumed (Q) | Total Utility (TU) (Utils) | Marginal Utility (MU) (Utils) |
1 | 10 | 10 |
2 | 18 | 8 |
3 | 24 | 6 |
4 | 28 | 4 |
5 | 30 | 2 |
6 | 30 | 0 (Satiety Point) |
7 | 28 | -2 |
Key Relationship Points
- : When is positive, increases (at a diminishing rate).
- : When is zero, reaches its maximum level (Point of Satiety).
- : When becomes negative, starts declining.
| Basis | Marginal Utility (MU) | Total Utility (TU) |
1 | Meaning | Extra utility from consuming one more unit | Total satisfaction from all units consumed |
2 | Calculation | MU = Change in TU / Change in quantity | TU = Sum of all marginal utilities |
3 | Value | Can be positive, zero, or negative | Increases at first, then becomes constant or falls |
4 | Effect of consumption | Decreases with each additional unit (usually) | Increases, reaches maximum, then may decline |
5 | Point of satiety | It become zero | It become maximum utility stage |
9) State the Law of Diminishing Marginal Utility (LDMU). Mention any two crucial assumptions of this law. (NCERT / MP 2019, 2024)
The Law of Diminishing Marginal Utility (LDMU) states that as a consumer consumes more and more standard units of a commodity continuously, the additional utility (satisfaction) derived from each successive unit keeps declining.
Two Crucial Assumptions:
1. Continuous Consumption: Consumption of units must take place continuously without time gaps.
2. Standard & Homogeneous Units: The consumed units must be of standard size and identical in quality, taste, and appearance.
10) Explain how an individual demand curve can be derived from the Law of Diminishing Marginal Utility using the single-commodity consumer equilibrium condition ( ). (NCERT)
Equilibrium Condition: A rational consumer in a single-good scenario achieves equilibrium where the marginal utility of the good (in money terms) equals its market price:
Derivation of Downward Slope:
1. As price falls ( ), . To restore equilibrium, the consumer must increase consumption of Good , which causes to fall (as per LDMU) until .
2. Conversely, if price rises ( ), . The consumer reduces consumption, raising until equality is restored.
Conclusion: This inverse relationship between price and quantity demanded—driven directly by diminishing marginal utility—results in a downward-sloping individual demand curve.
1.3 Ordinal Utility Analysis & Consumer Preferences
11) Define an Indifference Curve (IC) and an Indifference Map. (NCERT / MP 2020)
Indifference Curve (IC): A curve representing all combinations of two goods that give a consumer equal satisfaction, making the consumer indifferent among all bundles on that curve.
Indifference Map: A family or collection of indifference curves plotted on a single graph, where each higher curve represents a higher level of satisfaction.
12) What is meant by the Marginal Rate of Substitution (MRS)? Write its mathematical formula in terms of changes in Good 1 and Good 2 ( and ). (NCERT / MP 2019)
Marginal Rate of Substitution (MRS): The rate at which a consumer is willing to substitute Good 2 ( ) for one additional unit of Good 1 ( ) without altering the total level of satisfaction.
- Formula:
13) State the Law of Diminishing Marginal Rate of Substitution. How does this law determine the shape of an Indifference Curve? (NCERT / MP 2022)
Law of Diminishing MRS: As a consumer increases the consumption of Good 1 continuously, the quantity of Good 2 they are willing to give up to acquire each successive additional unit of Good 1 continuously diminishes.
Impact on IC Shape: This diminishing rate of substitution causes the Indifference Curve to be strictly convex to the origin.
14) Explain the concept of Monotonic Preferences of a consumer. (NCERT)
Monotonic Preferences: A consumer’s preferences are monotonic if between any two consumption bundles, the consumer always prefers the bundle that contains more of at least one good and no less of the other good.
- Implication: More of a good is always preferred to less because higher consumption leads to higher utility (non-satiation).
15) State and brief the main properties of Indifference Curves: (NCERT / MP 2018, 2023)
1. Downward Sloping from Left to Right: To maintain the same level of utility, an increase in the consumption of Good 1 must be accompanied by a decrease in the consumption of Good 2.
2. Convex to the Origin: Due to the Law of Diminishing Marginal Rate of Substitution ( ), the slope flattens as we move down along the curve.
3. Two ICs Never Intersect: If two curves intersected, it would imply that a single consumption bundle yields two different levels of satisfaction, which violates logical consistency and monotonic preferences.
4. Higher IC Represents Higher Satisfaction: A higher curve contains consumption bundles with larger quantities of both or at least one good, which offers greater satisfaction under monotonic preferences.
5. Do Not Touch Axes – Because consumer wants some of both goods.
16) What will be the shape of an Indifference Curve in the case of two perfect substitute goods? Draw a simple diagram or state the value of MRS in this case. (NCERT)
Shape: In the case of perfect substitute goods, the consumer is willing to trade Good 1 and Good 2 at a constant rate. Consequently, the Indifference Curve is a downward-sloping straight line rather than a convex curve.
Value of MRS: is constant throughout the line
1.4 The Consumer’s Budget
17) Define Budget Set and Budget Line. Write the mathematical equation for the budget line of a consumer. (NCERT / MP 2020)
| Basis | Budget line | Budget set |
1 | Meaning | Shows combinations of two goods that exactly spend all income | Shows all possible combinations within or on budget |
2 | Cost of bundles | Equal to income (M) | Less than or equal to income (≤ M) |
3 | Shape | Straight line | Area under and on the budget line |
4 | Satisfaction | Maximum affordable combinations | All affordable combinations |
5 | Formula | Px⋅X+Py⋅Y= M | Px⋅X+Py⋅Y≤ M |
18) Derive the equation of the budget line in slope-intercept form ( ). Identify the vertical intercept, horizontal intercept, and slope of the budget line from the equation. (NCERT / MP 2021)
- Derivation of Slope-Intercept Form:
Starting from the budget equation:
- Key Components:
- Vertical Intercept (Y-intercept): (Maximum units of Good 2 bought when )
- Horizontal Intercept (X-intercept): (Maximum units of Good 1 bought when )
- Slope:
19) What is the slope of the budget line? Explain its economic interpretation. (NCERT / MP 2019)
Slope of Budget Line: (the ratio of the prices of Good 1 and Good 2).
- Economic Interpretation: It represents the market rate of exchange or the opportunity cost. It shows the number of units of Good 2 the consumer must sacrifice in the market to obtain one extra unit of Good 1.
20) How does a change in the consumer’s income ( ) affect the budget line, keeping the prices of both goods constant? Illustrate with a diagram description. (NCERT / MP 2022)
An increase or decrease in consumer income ( ), with prices ( ) remaining constant, causes a parallel shift of the budget line:
- Increase in Income ( ): The budget line shifts outward/rightward parallel to the original line (slope remains unchanged at ).
- Decrease in Income ( ): The budget line shifts inward/leftward parallel to the original line.
- Explain the effect on the budget line when:
- Price of Good 1 ( ) changes while income ( ) and remain constant.
- Price of Good 2 ( ) changes while income ( ) and remain constant.
Change in ( and constant): Causes a pivot/rotation around the vertical intercept ( ).
- If decreases horizontal intercept ( ) moves outward budget line becomes flatter.
- If increases horizontal intercept moves inward budget line becomes steeper.
- Change in ( and constant): Causes a pivot/rotation around the horizontal intercept ( ).
- If decreases vertical intercept ( ) moves upward budget line rotates outward along Y-axis.
- If increases vertical intercept moves downward budget line rotates inward along Y-axis.
Changes in the Budget Line
|
|
|
|
↑ Income | Shifts outward (right) | ↓ Income | Shifts inward (left) |
↓ Price of X | Rotates outward along X-axis | ↑ Price of X | Rotates inward along X-axis |
↓ Price of Y | Rotates outward along Y-axis | ↑ Price of Y | Rotates inward along Y-axis |
1.5 Optimal Choice of the Consumer (Consumer’s Equilibrium)
21) What is meant by consumer’s equilibrium or optimal choice in indifference curve analysis? (NCERT / MP 2020)
Consumer’s Equilibrium / Optimal Choice: The state or point where a rational consumer spends their given income across goods in such a way that they attain maximum possible total satisfaction (utility), with no incentive to reallocate their expenditure.
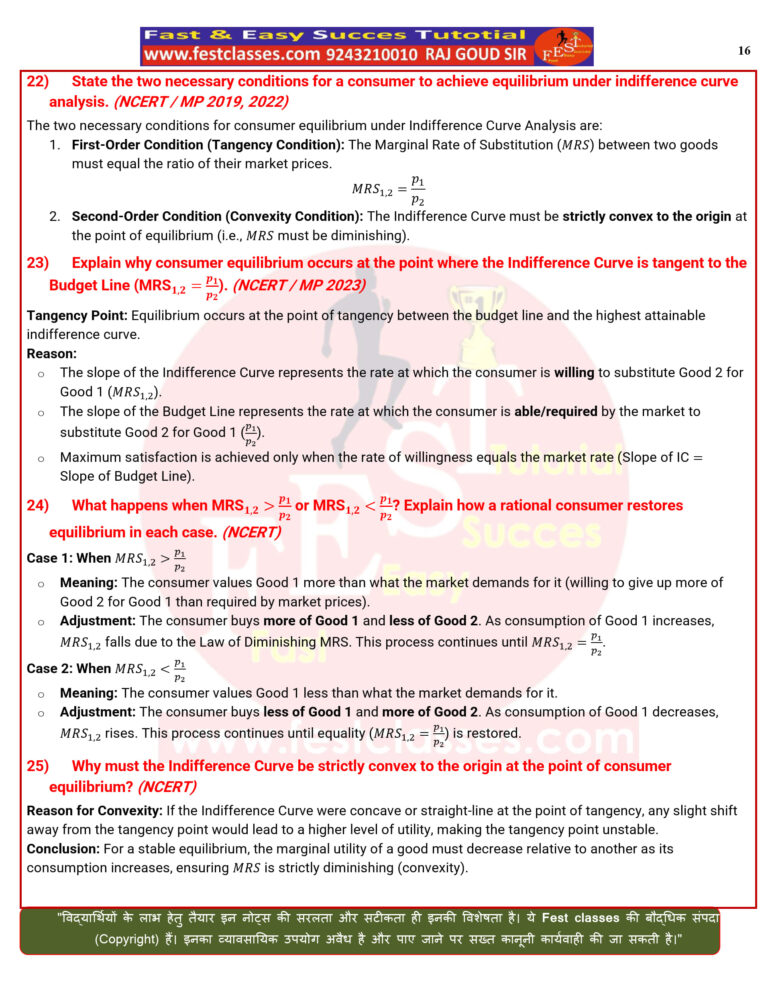
22) State the two necessary conditions for a consumer to achieve equilibrium under indifference curve analysis. (NCERT / MP 2019, 2022)
The two necessary conditions for consumer equilibrium under Indifference Curve Analysis are:
- First-Order Condition (Tangency Condition): The Marginal Rate of Substitution ( ) between two goods must equal the ratio of their market prices.
- Second-Order Condition (Convexity Condition): The Indifference Curve must be strictly convex to the origin at the point of equilibrium (i.e., must be diminishing).
23) Explain why consumer equilibrium occurs at the point where the Indifference Curve is tangent to the Budget Line ( ). (NCERT / MP 2023)
Tangency Point: Equilibrium occurs at the point of tangency between the budget line and the highest attainable indifference curve.
Reason:
o The slope of the Indifference Curve represents the rate at which the consumer is willing to substitute Good 2 for Good 1 ( ).
o The slope of the Budget Line represents the rate at which the consumer is able/required by the market to substitute Good 2 for Good 1 ( ).
o Maximum satisfaction is achieved only when the rate of willingness equals the market rate ( ).
24) What happens when or ? Explain how a rational consumer restores equilibrium in each case. (NCERT)
Case 1: When
o Meaning: The consumer values Good 1 more than what the market demands for it (willing to give up more of Good 2 for Good 1 than required by market prices).
o Adjustment: The consumer buys more of Good 1 and less of Good 2. As consumption of Good 1 increases, falls due to the Law of Diminishing MRS. This process continues until .
Case 2: When
o Meaning: The consumer values Good 1 less than what the market demands for it.
o Adjustment: The consumer buys less of Good 1 and more of Good 2. As consumption of Good 1 decreases, rises. This process continues until equality ( ) is restored.
25) Why must the Indifference Curve be strictly convex to the origin at the point of consumer equilibrium? (NCERT)
Reason for Convexity: If the Indifference Curve were concave or straight-line at the point of tangency, any slight shift away from the tangency point would lead to a higher level of utility, making the tangency point unstable.
Conclusion: For a stable equilibrium, the marginal utility of a good must decrease relative to another as its consumption increases, ensuring is strictly diminishing (convexity).
1.6 Demand Analysis & The Law of Demand
26) Define Demand and Demand Function. Write the mathematical equation for a linear demand curve and identify its components ( and ). (NCERT / MP 2021)
Demand: The quantity of a commodity that a consumer is willing and able to buy at a given price during a specific period of time.
1. desire (Wish)
2. want (Ability to satisfy)
3. demand (linked with price)
Demand Function: The functional/mathematical relationship between the quantity demanded of a commodity and the various factors affecting it (such as its price, income, prices of related goods, etc.).
Linear Demand Curve Equation:
= Quantity demanded , = Price of the commodity , = Vertical intercept (Quantity demanded when price is zero, i.e., autonomous demand) , = Slope parameter / rate of change of quantity demanded with respect to price ( )
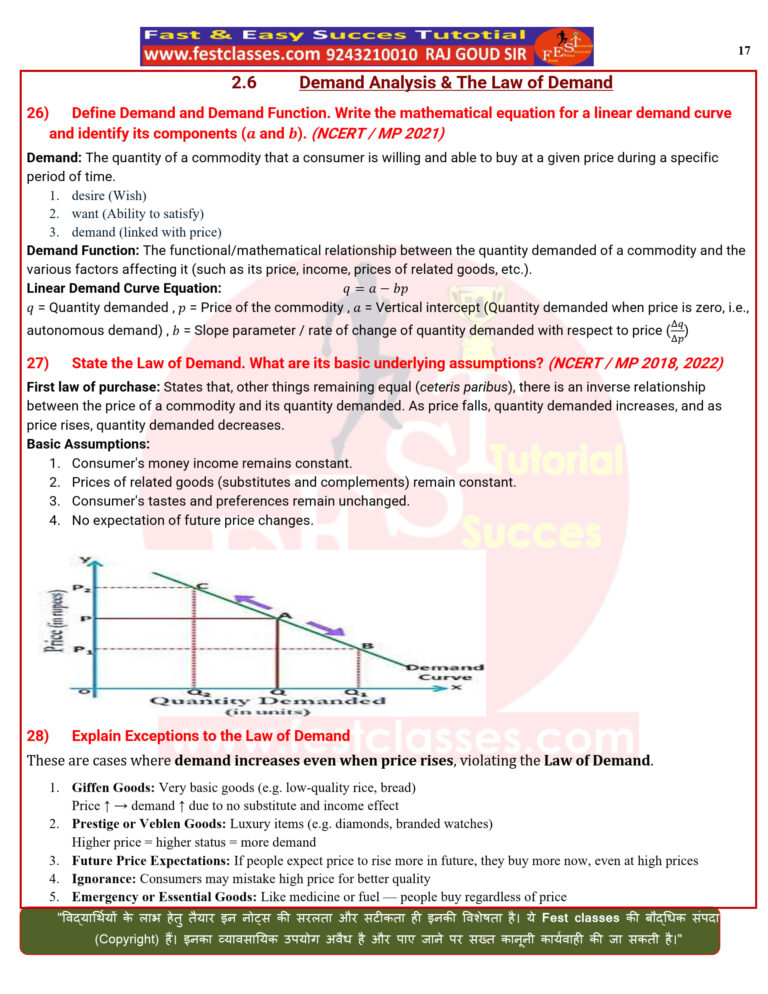
27) State the Law of Demand. What are its basic underlying assumptions? (NCERT / MP 2018, 2022)
First law of purchase: States that, other things remaining equal (ceteris paribus), there is an inverse relationship between the price of a commodity and its quantity demanded. As price falls, quantity demanded increases, and as price rises, quantity demanded decreases.
Basic Assumptions:
1. Consumer’s money income remains constant.
2. Prices of related goods (substitutes and complements) remain constant.
3. Consumer’s tastes and preferences remain unchanged.
4. No expectation of future price changes.
28) Explain Exceptions to the Law of Demand
These are cases where demand increases even when price rises, violating the Law of Demand.
1. Giffen Goods: Very basic goods (e.g. low-quality rice, bread)
Price ↑ → demand ↑ due to no substitute and income effect
2. Prestige or Veblen Goods: Luxury items (e.g. diamonds, branded watches)
Higher price = higher status = more demand
3. Future Price Expectations: If people expect price to rise more in future, they buy more now, even at high prices
4. Ignorance: Consumers may mistake high price for better quality
5. Emergency or Essential Goods: Like medicine or fuel — people buy regardless of price
29) Write The determinants of individual demand
1. Own price: when the price of a commodity falls, its quantity demand increases, and when its price rises, its quantity demand decreases.
2. Price of related goods: the quantity demand of a commodity is affected by the price of its related commodity, like its substitutes and complementary goods.
3. Substitute Goods: Those goods which are used in place of each other are called substitutes. Ex: Tea and Coffee
4. Complementary Goods: Those goods which are used jointly are called complementary. Ex: Tea and Sugar
5. Income of the consumer: When the income of a consumer rises, their quantity demand will increase, and when income falls, quantity demand decreases
6. Tastes and preferences: if a commodity is in fashion or preferred by the consumer, then its demand will increase, and if it is out of fashion, its demand will decrease.
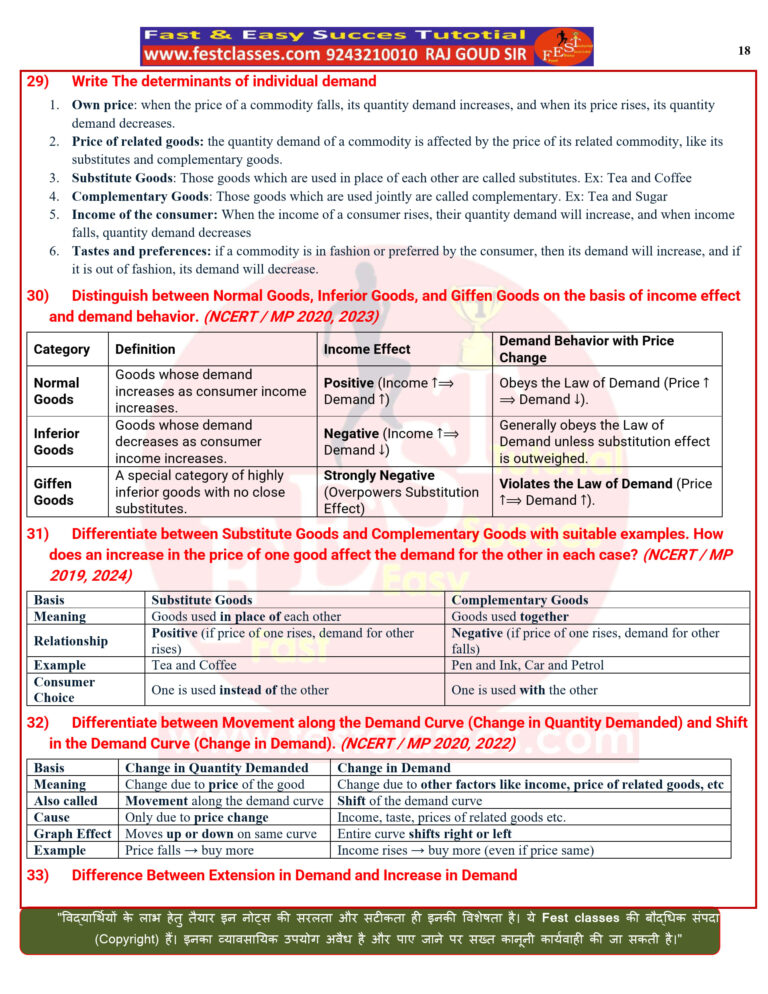
30) Distinguish between Normal Goods, Inferior Goods, and Giffen Goods on the basis of income effect and demand behavior. (NCERT / MP 2020, 2023)
Category | Definition | Income Effect | Demand Behavior with Price Change |
Normal Goods | Goods whose demand increases as consumer income increases. | Positive (Income Demand ) | Obeys the Law of Demand (Price Demand ). |
Inferior Goods | Goods whose demand decreases as consumer income increases. | Negative (Income Demand ) | Generally obeys the Law of Demand unless substitution effect is outweighed. |
Giffen Goods | A special category of highly inferior goods with no close substitutes. | Strongly Negative (Overpowers Substitution Effect) | Violates the Law of Demand (Price Demand ). |
31) Differentiate between Substitute Goods and Complementary Goods with suitable examples. How does an increase in the price of one good affect the demand for the other in each case? (NCERT / MP 2019, 2024)
Basis | Substitute Goods | Complementary Goods |
Meaning | Goods used in place of each other | Goods used together |
Relationship | Positive (if price of one rises, demand for other rises) | Negative (if price of one rises, demand for other falls) |
Example | Tea and Coffee | Pen and Ink, Car and Petrol |
Consumer Choice | One is used instead of the other | One is used with the other |
32) Differentiate between Movement along the Demand Curve (Change in Quantity Demanded) and Shift in the Demand Curve (Change in Demand). (NCERT / MP 2020, 2022)
Basis | Change in Quantity Demanded | Change in Demand |
Meaning | Change due to price of the good | Change due to other factors like income, price of related goods, etc |
Also called | Movement along the demand curve | Shift of the demand curve |
Cause | Only due to price change | Income, taste, prices of related goods etc. |
Graph Effect | Moves up or down on same curve | Entire curve shifts right or left |
Example | Price falls → buy more | Income rises → buy more (even if price same) |
33) Difference Between Extension in Demand and Increase in Demand
Basis | Extension in Demand | Increase in Demand |
Meaning | Rise in quantity demanded due to fall in price, shown as movement along the demand curve. | Rise in demand due to other factors (like income, taste), shown as rightward shift of the demand curve. |
Cause | Due to fall in price | Due to other factors (e.g. income ↑) |
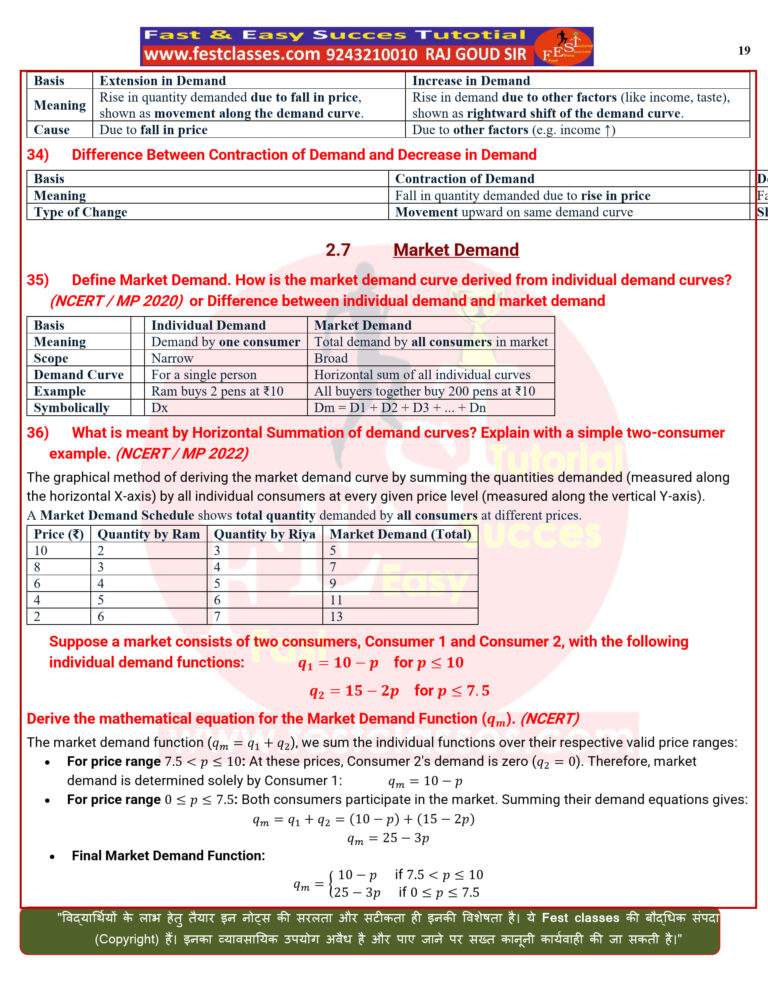
34) Difference Between Contraction of Demand and Decrease in Demand
Basis | Contraction of Demand | Decrease in Demand |
Meaning | Fall in quantity demanded due to rise in price | Fall in demand due to other factors |
Type of Change | Movement upward on same demand curve | Shift of demand curve to the left |
1.7 Market Demand
35) Define Market Demand. How is the market demand curve derived from individual demand curves? (NCERT / MP 2020) or Difference between individual demand and market demand
Basis |
| Individual Demand | Market Demand |
Meaning |
| Demand by one consumer | Total demand by all consumers in market |
Scope |
| Narrow | Broad |
Demand Curve |
| For a single person | Horizontal sum of all individual curves |
Example |
| Ram buys 2 pens at ₹10 | All buyers together buy 200 pens at ₹10 |
Symbolically |
| Dx | Dm = D1 + D2 + D3 + … + Dn |
36) What is meant by Horizontal Summation of demand curves? Explain with a simple two-consumer example. (NCERT / MP 2022)
The graphical method of deriving the market demand curve by summing the quantities demanded (measured along the horizontal X-axis) by all individual consumers at every given price level (measured along the vertical Y-axis).
A Market Demand Schedule shows total quantity demanded by all consumers at different prices.
Price (₹) | Quantity by Ram | Quantity by Riya | Market Demand (Total) |
10 | 2 | 3 | 5 |
8 | 3 | 4 | 7 |
6 | 4 | 5 | 9 |
4 | 5 | 6 | 11 |
2 | 6 | 7 | 13 |
Suppose a market consists of two consumers, Consumer 1 and Consumer 2, with the following individual demand functions:
Derive the mathematical equation for the Market Demand Function ( ). (NCERT)
The market demand function ( ), we sum the individual functions over their respective valid price ranges:
· For price range : At these prices, Consumer 2’s demand is zero ( ). Therefore, market demand is determined solely by Consumer 1:
· For price range : Both consumers participate in the market. Summing their demand equations gives:
- Final Market Demand Function:
37) Explain why the market demand curve is generally flatter than the individual demand curves from which it is derived. (NCERT)
- Negative Slope → Shows inverse relationship between price and quantity.
- Steeper Slope → Less responsive demand (inelastic).
- Flatter Slope → More responsive demand (elastic).
- In most cases, demand curves slope downward from left to right.
1.8 Elasticity of Demand
38) Define Price Elasticity of Demand ( ) write its general mathematical formula. (NCERT / MP 2021)
- Price Elasticity of Demand ( ): A measure of the degree of responsiveness of quantity demanded of a commodity to a change in its own price.
- General Formula:
39) Explain the Percentage / Proportionate Method of measuring price elasticity of demand. Write the formula using price ( ), quantity ( ), and their changes ( ). (NCERT / MP 2019, 2023)
- Percentage / Proportionate Method: Measures elasticity as the ratio of the proportionate change in quantity demanded to the proportionate change in price.
- Formula:
- = Initial quantity demanded, = Initial price
- = Change in quantity demanded ( ), = Change in price ( )
(The minus sign reflects the inverse relationship between price and quantity demanded; is treated as a positive magnitude).
40) Distinguish between the 5 degrees of price elasticity of demand ( , , , , ) with respect to the shape of their demand curves. (NCERT / MP 2018, 2020, 2024)
Degree | Description | Numerical Value | Demand Curve Shape |
Perfectly Inelastic | Quantity demanded does not change at all with price change. |
| Vertical line (parallel to Y-axis) |
Inelastic (Less Elastic) | % change in quantity demanded is less than % change in price. |
| Steeper downward-sloping curve |
Unitary Elastic | % change in quantity demanded equals % change in price. |
| Rectangular hyperbola |
Elastic (More Elastic) | % change in quantity demanded is greater than % change in price. |
| Flatter downward-sloping curve |
Perfectly Elastic | Infinite change in quantity demanded at a given price. |
| Horizontal line (parallel to X-axis) |
41) Explain the Total Expenditure Method (Marshall’s Method) for measuring price elasticity of demand. How do we determine whether , , or using this method? (NCERT / MP 2022)
Total Expenditure Method: Evaluates elasticity by analyzing how total expenditure ( ) changes when price changes.
- Elastic Demand ( ): Price and total expenditure move in opposite directions (If price falls, total expenditure increases; if price rises, total expenditure decreases).
- Unitary Elastic Demand ( ): Total expenditure remains unchanged when price changes.
- Inelastic Demand ( ): Price and total expenditure move in the same direction (If price falls, total expenditure decreases; if price rises, total expenditure increases).
42) Explain the Geometric / Point Method of calculating price elasticity of demand at any point on a linear demand curve. Write the geometric formula. (NCERT)
Geometric / Point Method: Measures price elasticity of demand at any specific point on a linear demand curve.
- Formula:
- Values along a Linear Demand Curve:
- Mid-point: (Lower segment = Upper segment)
- Above mid-point:
- Y-intercept (Top end):
- Below mid-point:
- X-intercept (Bottom end):
43) Explain any four major factors affecting the price elasticity of demand for a commodity. (NCERT / MP 2019, 2023)
- Availability of Close Substitutes: Goods with readily available close substitutes (e.g., tea and coffee) have elastic demand ( ), whereas goods with no close substitutes (e.g., salt, electricity) have inelastic demand ( ).
- Nature of the Commodity: Necessities (e.g., life-saving medicines, basic food items) have inelastic demand ( ). Luxuries (e.g., air conditioners, sports cars) have elastic demand ( ).
- Proportion of Income Spent: Goods on which consumers spend a negligible fraction of their income (e.g., matchboxes, safety pins) have inelastic demand. Goods requiring a large proportion of income (e.g., housing, automobiles) have elastic demand.
- Time Period: In the short run, demand is relatively inelastic because consumers take time to adjust habits or find alternatives. In the long run, demand becomes more elastic.